Analytics Dashboard
A personal developer performance dashboard — not a monitoring tool. Track productivity, cost, and reliability across all AI coding providers. All data stays on your machine.
Open it: Ctrl+Shift+P -> MR Multi coder: Open Analytics Dashboard
Dashboard Preview
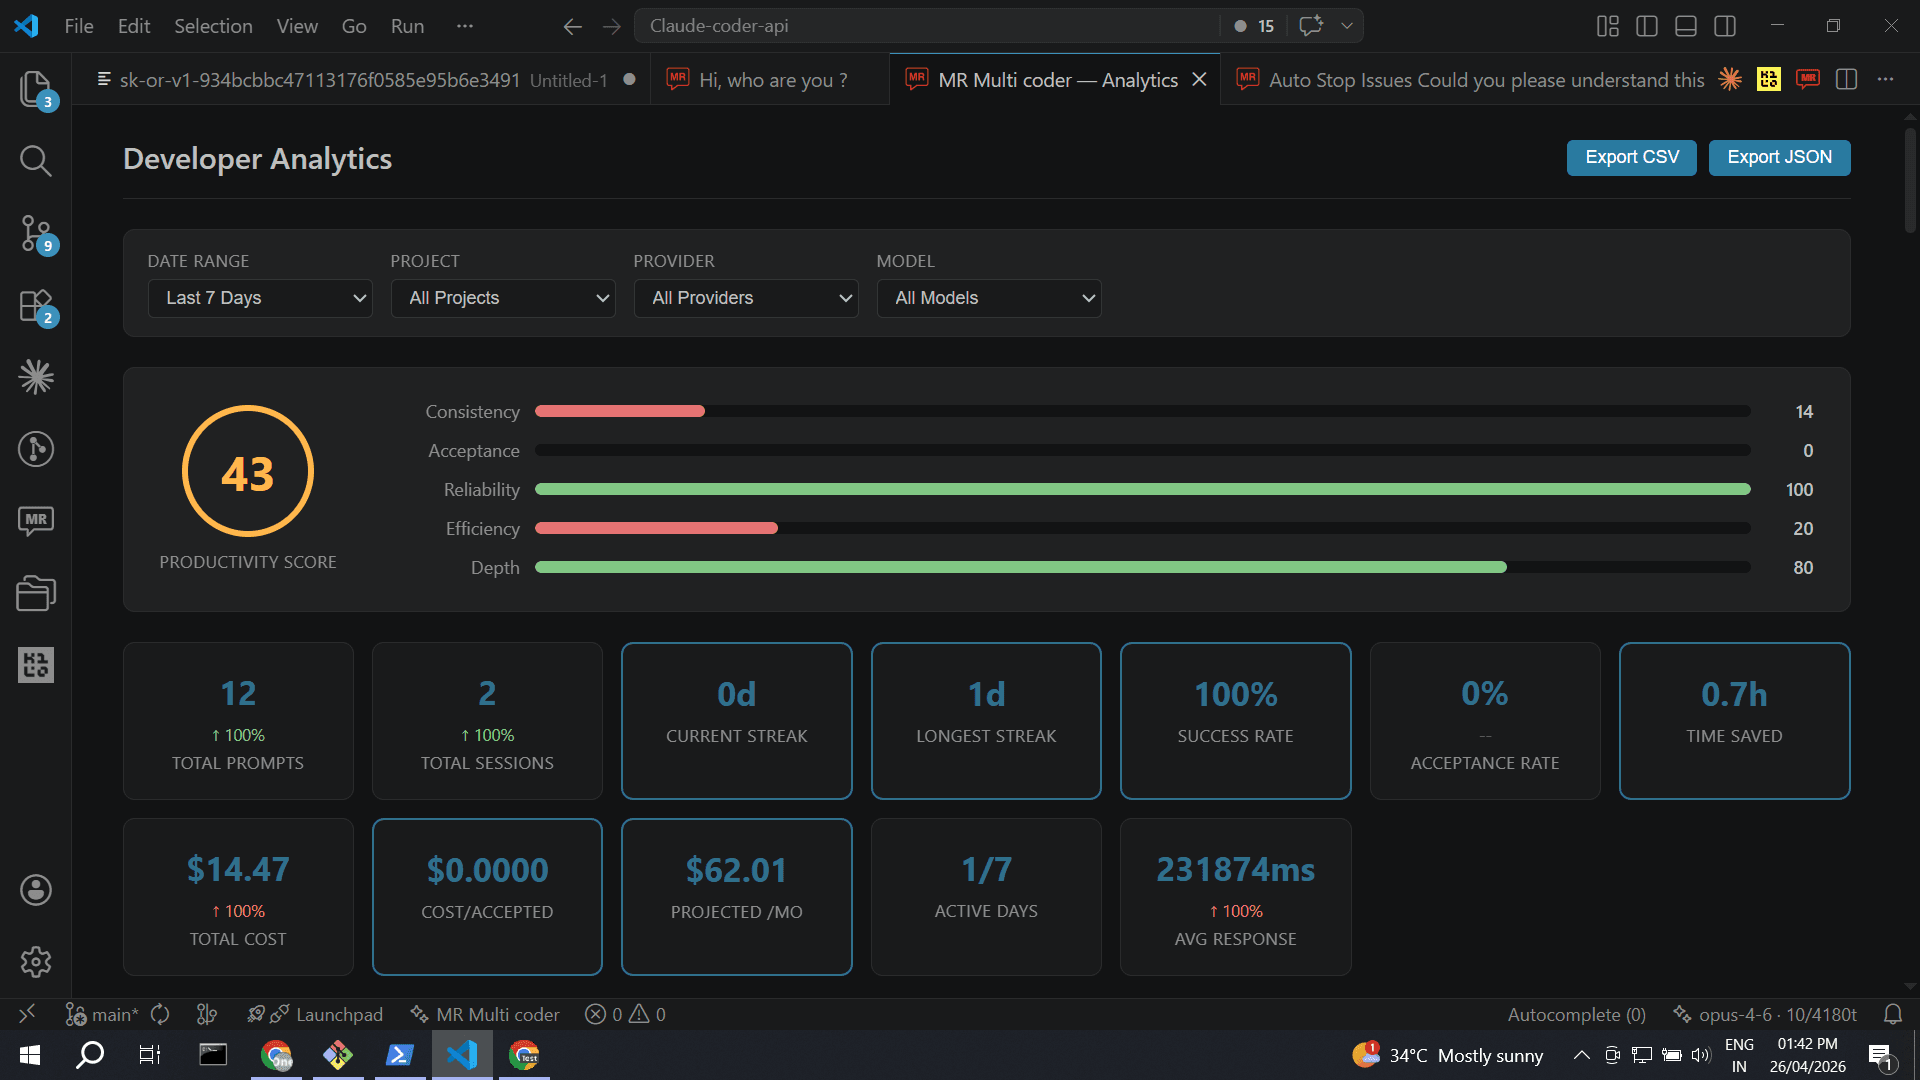
Filters, productivity score ring with component bars, and 12 KPI cards with period-over-period deltas
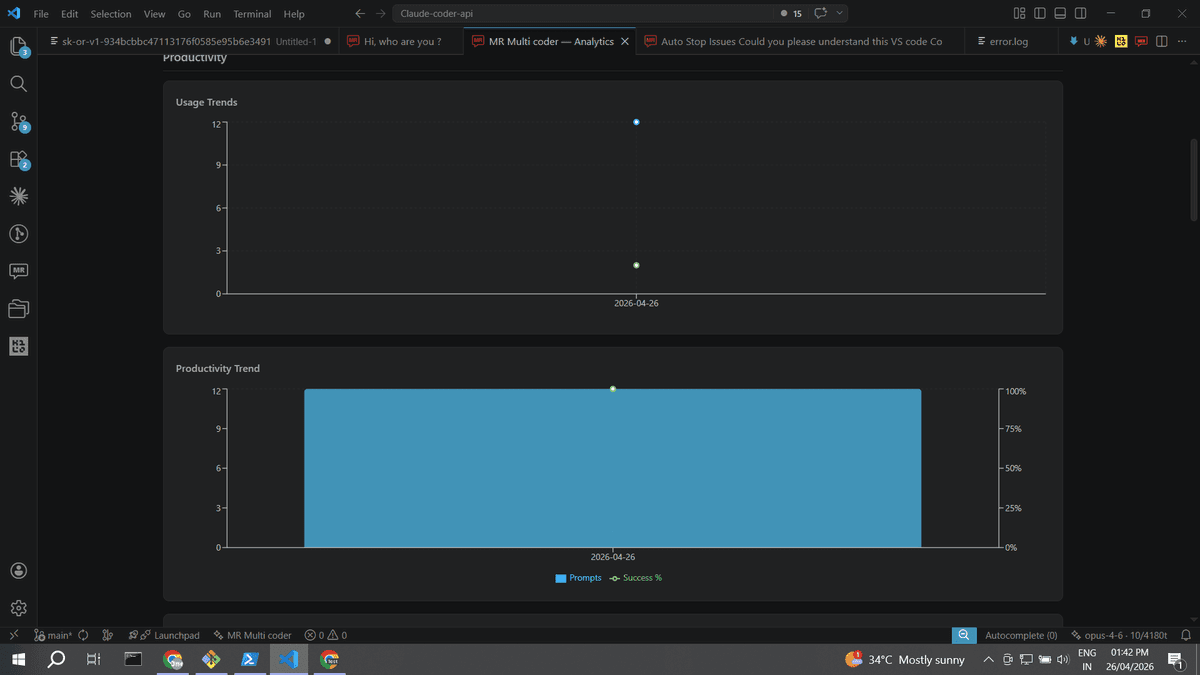
Usage Trends & Productivity Trend
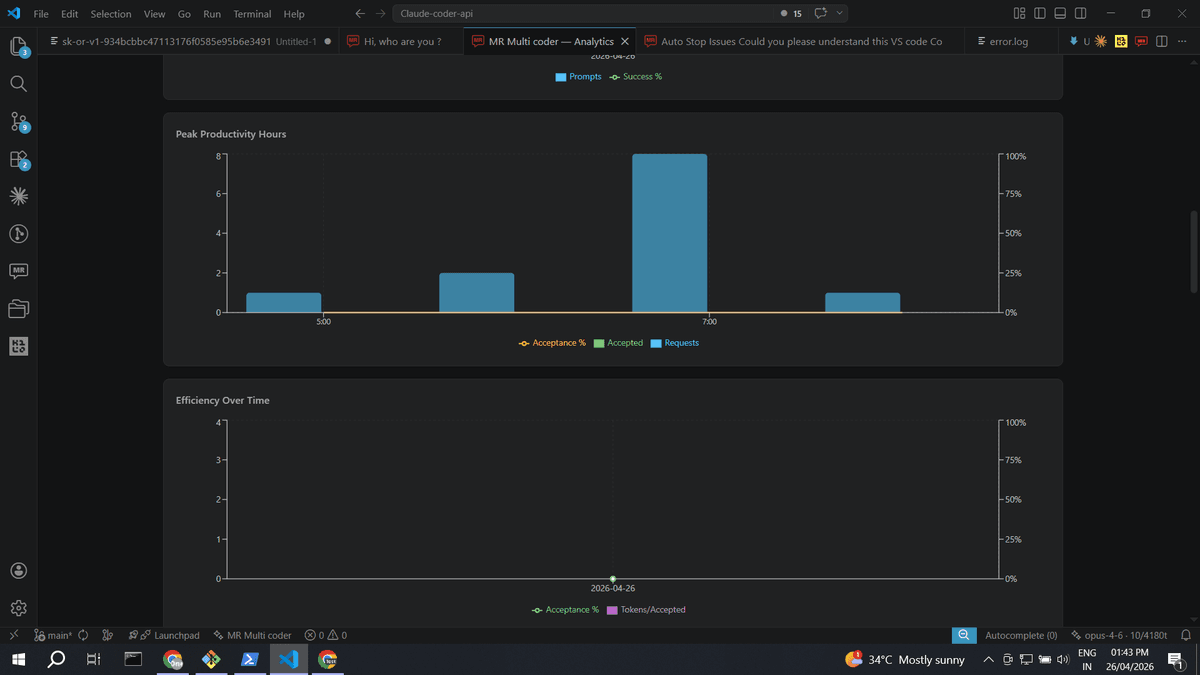
Peak Hours & Efficiency Over Time
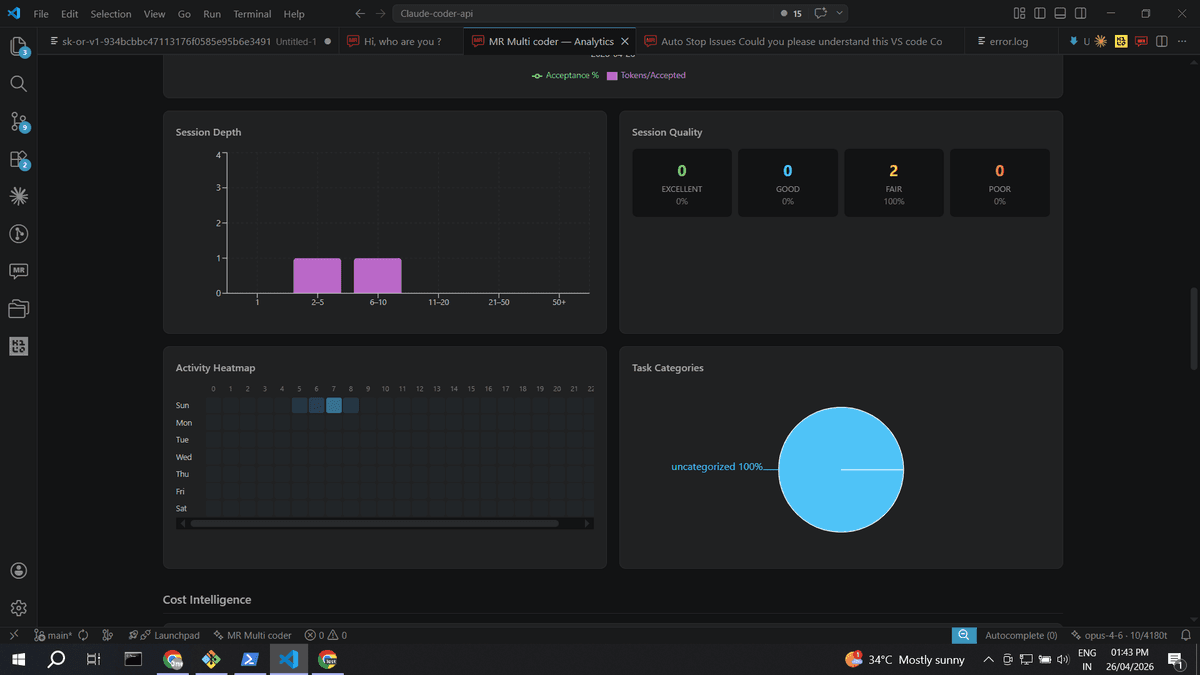
Session Depth, Quality, Heatmap & Task Categories
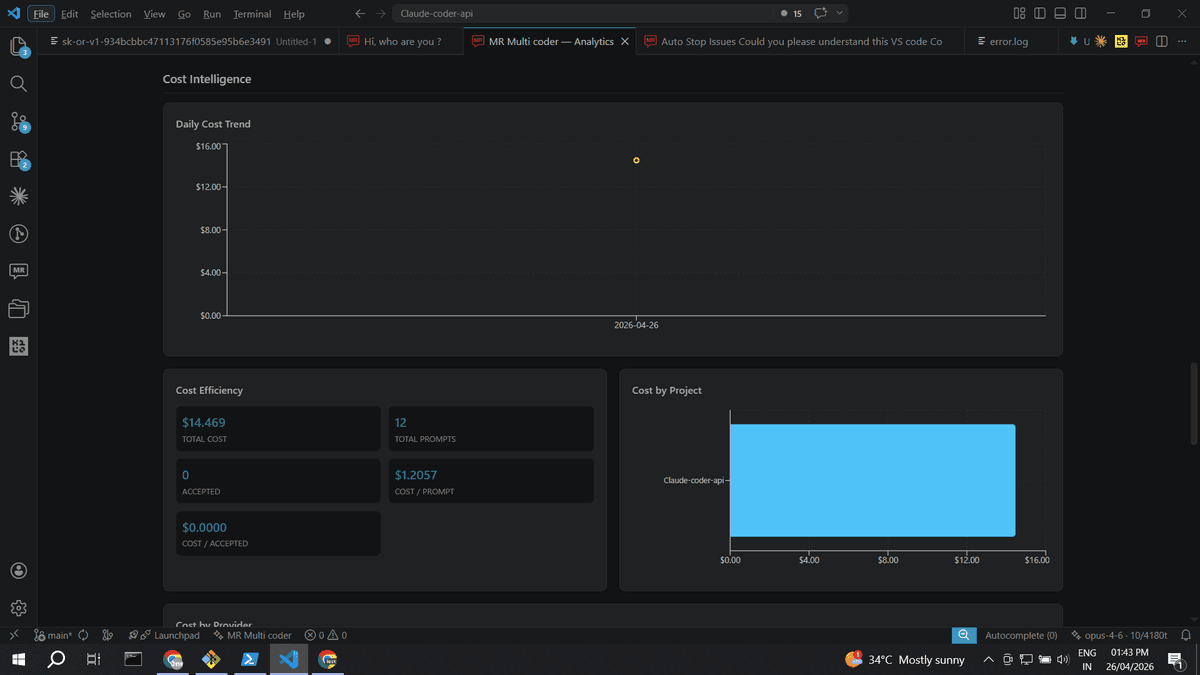
Cost Intelligence — Daily Trend, Efficiency & By Project
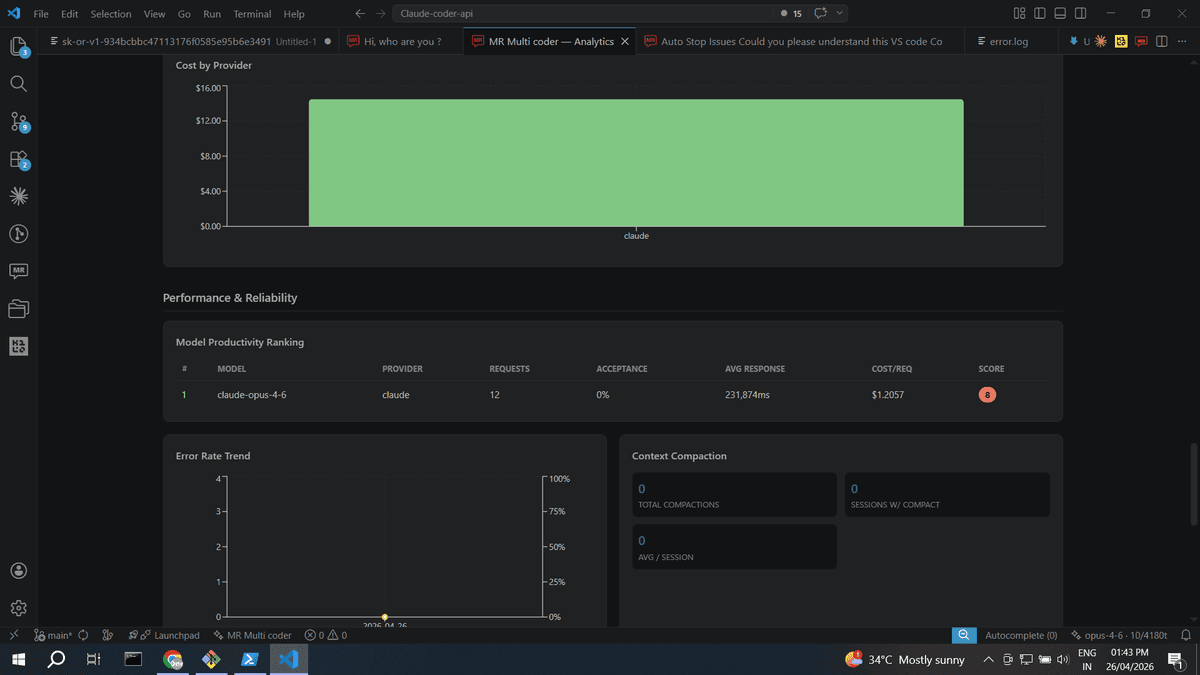
Model Ranking, Error Rate & Context Compaction
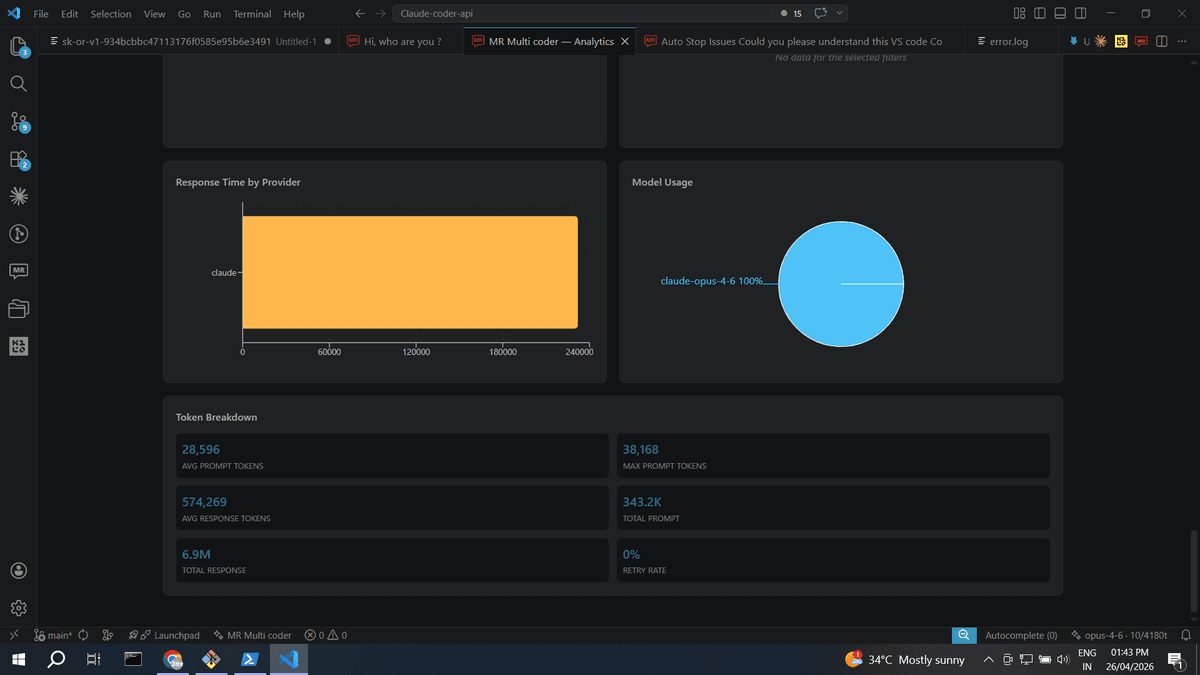
Response Time, Model Usage & Token Breakdown
How Data Is Collected
All analytics data comes from a local database stored on your machine. No data ever leaves your machine.
Provider turn completes
  -> AnalyticsCollector records event
    -> AnalyticsStore inserts row into SQLite
      -> Dashboard queries the same DB on open
What Gets Recorded
| Field | Source |
|---|---|
timestamp | Wall clock at response completion |
session_id | Current chat session |
project_id | Workspace folder name |
provider | Active provider (claude, kilo, qwen, etc.) |
model | Model identifier (e.g. claude-sonnet-4-6) |
prompt_tokens | Tokens in the request |
response_tokens | Tokens in the response |
response_time_ms | End-to-end latency |
status | success or failure |
task_category | debugging, refactoring, code_generation, documentation |
accepted | Whether the suggestion was accepted |
Privacy
- - No source code is stored. Only metadata (token counts, timing, status).
- - No API keys or credentials are ever logged.
- - Fully opt-out: set mrMultiCoder.analytics.enabled to false.
- - Local-only storage. The database is never uploaded, synced, or shared.
Productivity Score
A single composite metric (0-100) answering "How productive am I with AI assistance?" Displayed as a colour-coded ring with five component bars.
| Component | Weight | What It Measures |
|---|---|---|
| Consistency | 20% | How regularly you use the tool |
| Acceptance | 25% | How often you keep AI suggestions |
| Reliability | 25% | How error-free your interactions are |
| Efficiency | 15% | How fast the AI responds |
| Depth | 15% | How engaged your sessions are |
Colour thresholds: Green (80+), Blue (60-79), Yellow (40-59), Red (<40).
KPI Cards
Twelve key metrics displayed as cards. Each card shows the current value and a delta arrow with percentage change vs. the equivalent previous period.
| KPI | Notes |
|---|---|
| Total Prompts | Total AI interactions |
| Total Sessions | Distinct conversations |
| Current Streak | Consecutive active days ending today |
| Longest Streak | Best streak in the date range |
| Success Rate | % of interactions without errors |
| Acceptance Rate | % of suggestions the user kept |
| Time Saved | Estimated hours saved (configurable minutes per task) |
| Total Cost | Estimated USD spend — decrease is green |
| Cost/Accepted | Cost per accepted suggestion |
| Projected /mo | Daily average x 30 |
| Active Days | Days used out of range |
| Avg Response | Mean response latency — decrease is green |
Productivity Charts
Usage Trends
Line chart showing prompts and sessions per day. Answers: "Am I using the tool more or less over time?"
Productivity Trend
Dual-axis chart: prompt volume (bars) overlaid with success rate % (line).
Peak Productivity Hours
24-hour chart showing requests, accepted suggestions, and acceptance rate by hour.
Efficiency Over Time
Tokens per accepted suggestion vs. acceptance rate — downward trend means better prompting.
Session Depth Distribution
Bar chart bucketing sessions by turn count: 1, 2-5, 6-10, 11-20, 21-50, 50+.
Session Quality
Four cards classifying sessions: Excellent (70%+ acceptance, <10% errors, 3+ turns), Good, Fair, Poor.
Activity Heatmap
7x24 grid (day of week x hour) with opacity-scaled cells.
Task Categories
Pie chart: debugging, refactoring, code generation, documentation, uncategorized.
Cost Intelligence
Daily Cost Trend
Area chart with gradient fill showing estimated daily spend.
Cost Efficiency
Summary card: Total Cost, Total Prompts, Accepted, Cost/Prompt, Cost/Accepted.
Cost by Project
Horizontal bar chart ranking projects by spend (top 8).
Cost by Provider
Vertical bar chart comparing cost across providers.
Cost Estimation Rates
| Model | Rate (per 1K tokens) |
|---|---|
| Claude Sonnet 4.6 | $0.003 |
| Claude Opus 4.8 | $0.015 |
| Claude Haiku 5.5 | $0.0001 |
| Qwen3 Coder Plus | $0.0004 |
| Default (all others) | $0.002 |
Free-tier providers (Kilo, OpenRouter free models, Ollama) show zero cost.
Performance & Reliability
Model Productivity Ranking
Sortable table ranking every model by composite score (60% acceptance + 40% speed).
Error Rate Trend
Dual-axis chart: error count (bars) and error rate % (line).
Context Compaction
Tracks total compactions, sessions with compaction, and daily frequency.
Response Time by Provider
Horizontal bar chart comparing average response time across providers.
Model Usage
Pie chart showing request distribution across models.
Token Breakdown
Six-metric summary: avg/max prompt tokens, avg response tokens, total tokens, retry rate.
Goal Setting & Tracking
Set personal targets in VS Code settings under mrMultiCoder.analytics.goals.*
| Setting | Default | What It Tracks |
|---|---|---|
acceptanceRate | 0 (off) | Target acceptance rate — shown as a goal line |
dailyPrompts | 0 (off) | Target daily prompts — shown as a goal line |
maxCostPerDay | 0 (off) | Cost ceiling — shown as a limit line |
maxResponseTimeMs | 0 (off) | Response time target — shown as a limit line |
When active, a Goal Status Bar appears with colour-coded chips and KPI cards get coloured borders. Set any goal to 0 to disable.
Filters & Export
Global Filters
| Filter | Options | Default |
|---|---|---|
| Date Range | Today, Last 7/30/90 Days, Last 6 Months, This Year, Custom | Last 7 Days |
| Project | All Projects, or any workspace in the data | All |
| Provider | All Providers, or any provider with events | All |
| Model | All Models, or any model (filtered by provider) | All |
Export
Two formats available via header buttons: CSV (flat table of all raw events) and JSON (structured format). Both respect current filters.
Additional Features
Period-over-Period Comparison
Every trend chart includes a dashed overlay showing the equivalent previous period for visual comparison.
Real-Time Auto-Refresh
Dashboard refreshes every 30 seconds by default (configurable). A green pulsing dot indicates live status.
Timeline Annotations
Mark important events (e.g. "Deployed v2.0") on timeline charts. Stored in SQLite, persists across sessions.
Calibrated Time Saved
Default: 5 minutes per accepted suggestion. Configurable via mrMultiCoder.analytics.minutesPerTask (1-60 minutes).
Drill-Down
Click any data point on Usage Trends to see every session for that date with full details.
Analytics Settings
| Setting | Default | Description |
|---|---|---|
mrMultiCoder.analytics.enabled | true | Enable/disable analytics data collection |
mrMultiCoder.analytics.minutesPerTask | 5 | Minutes saved per accepted suggestion (1-60) |
mrMultiCoder.analytics.refreshIntervalSeconds | 30 | Auto-refresh interval (0 = disabled, max 300) |
mrMultiCoder.analytics.goals.acceptanceRate | 0 | Target acceptance rate (0-100%). 0 = off |
mrMultiCoder.analytics.goals.dailyPrompts | 0 | Target daily prompts. 0 = off |
mrMultiCoder.analytics.goals.maxCostPerDay | 0 | Max daily cost in USD. 0 = off |
mrMultiCoder.analytics.goals.maxResponseTimeMs | 0 | Max response time in ms. 0 = off |